
Security
Learn how to navigate the security section of the dashboard.
The Security dashboard is a security and event management (SIEM) interface that helps you detect potential threats before they disrupt your business or cause damage. It provides you with an overview of your security status and allows you to pinpoint specific anomaly incidents.
Geographical Events
The first section of the Security dashboard displays a list of the cities with the Top Account and Financial Events over a certain period of time, and a map displaying the locations.
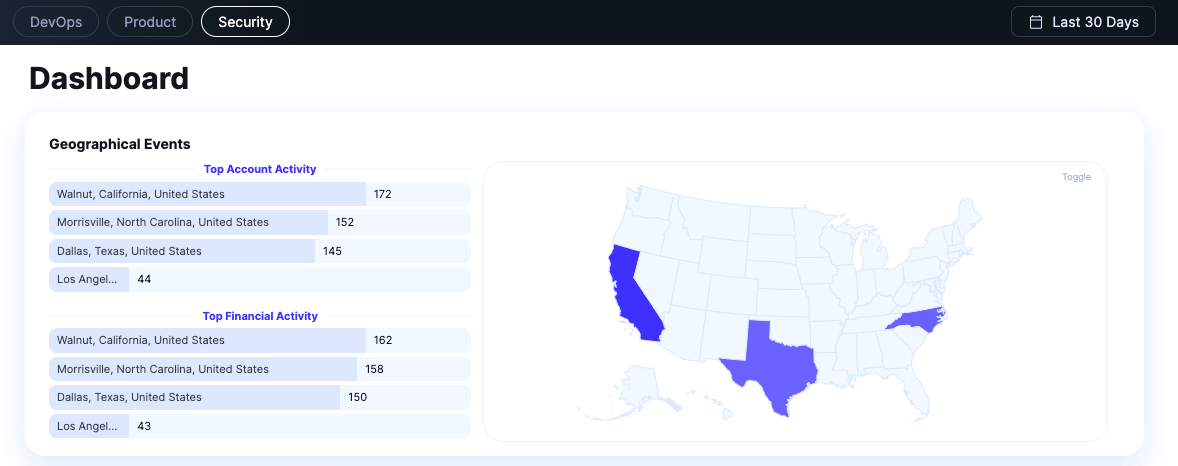
Account Events are sensitive actions taken from your users pertaining to authorization or authentication (ie: password resets, account change update, etc.).
Financial Events relate to financial activity - payment receipts, wire transfers, updated banking info update, etc.
These figures give you a benchmark of activity levels for sensitive account and financial events across different regions, and help you quickly find abnormal behavior from different engagement locations. You can toggle between a map of the US and the World to see engagement from any location.
Account Events
The next section displays visualizations for Total Account Events and Daily Account Events metrics.
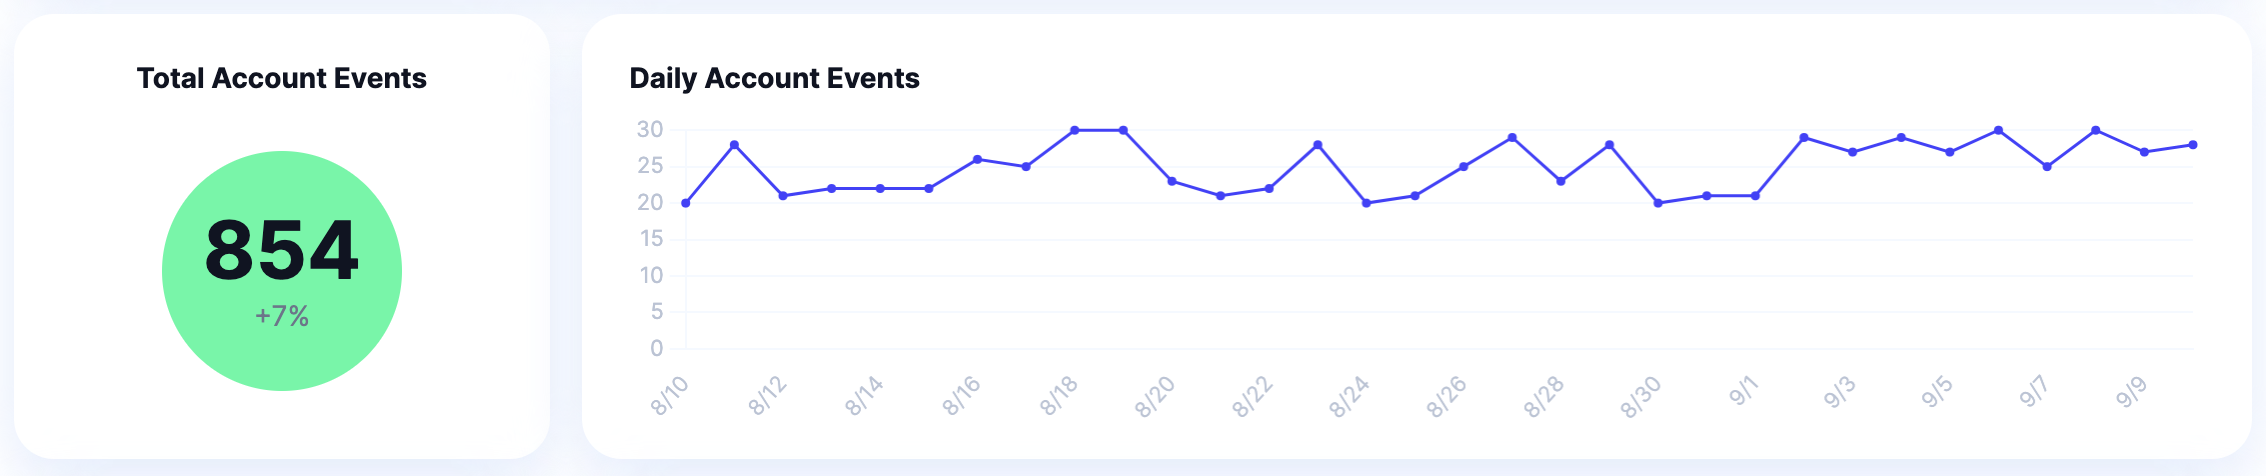
Total Account Events are the total number of sensitive account-related activities over a period. Below this metric, you'll see the percent change since the last period. This metric helps you understand the baseline number of sensitive actions within a certain period and tells you how these numbers are trending.
Daily Account Events are the daily number of sensitive account-related activities over a period. These numbers are displayed in a line graph and help you easily identify outliers in user activity.
Financial Events
The last section displays visualizations for Total Financial Events and Daily Financial Events metrics.
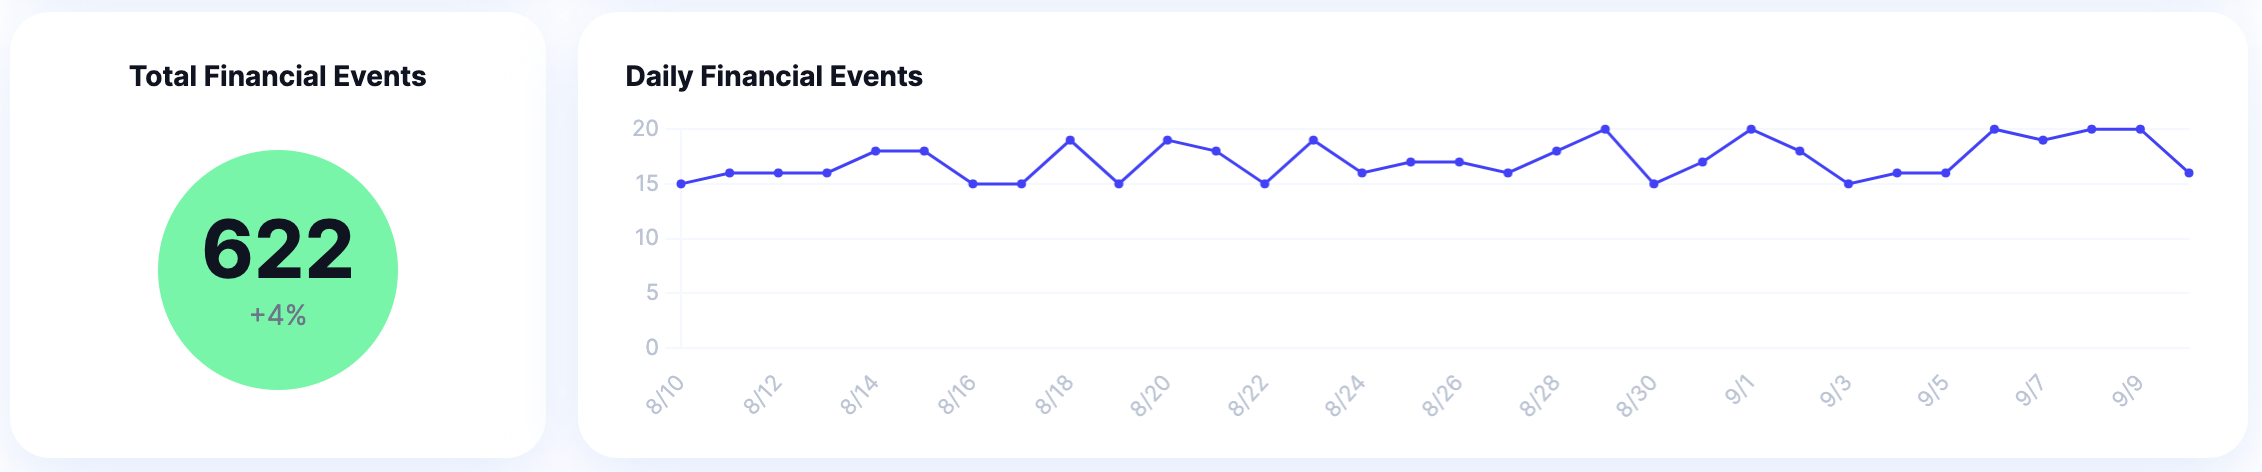
Total Financial Events are the total number of financial-related activities over a period. Below this metric, you'll see the percent change since the last period. It helps you understand the baseline number of actions related to financial activity within a certain period and shows you how these numbers are trending.
Daily Financial Events are the daily number of financial-related activities over a period. These numbers are displayed in a line graph and help you easily identify anomalies in financial activity.
[Security] displays sensitive account and financial events, and makes it easy for you to track your security status. It enables you to pinpoint anomalies in locations and activity.
Security
- Security Dashboard gives insight into sensitive account and financial events, making it easy to identify anomalies
- Easily investigate account compromise with an audit trail of all email activity and metadata (stored for 2 years)
- IP/country allowlist and blocklist that notifies you of violations
- [Coming Soon] Email-based Intrusion detection system to help you identify compromised users within your application and prevent lateral account takeover from compromised email accounts
❗Security-Related Features & Metrics
| Feature Name | Description |
|---|---|
| Daily Account Events | This metric tells you the daily number of sensitive account-related activities over a period. Allows you to easily find anomalies in user activity. Easily find anomalies in sensitive user actions. It is shown as a line graph. |
| Daily Financial Events | Shows you the daily number of financial-related activities over a period. Allows you to easily find anomalies in financial activity. It is shown as a line graph. |
| Geographical Events | This is a map that shows you all of the locations your users are engaging with you from. You can toggle between a map of the US and the World. Helps you quickly find anomalies in engagement locations. |
| Security Dashboard | This dashboard shows you everything you need to know about your users' security. It displays a US and World map of the top engagement locations, total account events, daily account events, total financial events, and daily financial events. This gives you an overview of your security status and allows you to pinpoint specific anomaly incidents. Learn more about this feature here. |
| Total Account Events | This metric tells you the total number of sensitive account-related activities over a period and the percent changed since the last period. It helps you understand the baseline number of sensitive actions (email changes, password resets, magic sign in links, etc) within a certain period. |
| Total Financial Events | This metric tells you the total number of financial-related activities over a period and the percent changed since the last period. It helps you understand the baseline number of actions related to financial activity (payment receipts, wire transfers, updated banking info) within a certain period. |
| IDS (Intrusion Detection System) - COMING SOON | This feature enables you to identify compromised users and prevent lateral account takeover via email clients. It's not released yet but we will notify you once it's ready! |
Updated 9 months ago