
Delivery Dashboard
Learn how to navigate the Delivery section of the dashboard.
The Delivery dashboard includes everything you need to know about your overall delivery health. Amply makes it easy for you to monitor your infrastructure health with visualizations and activity feeds of live events.
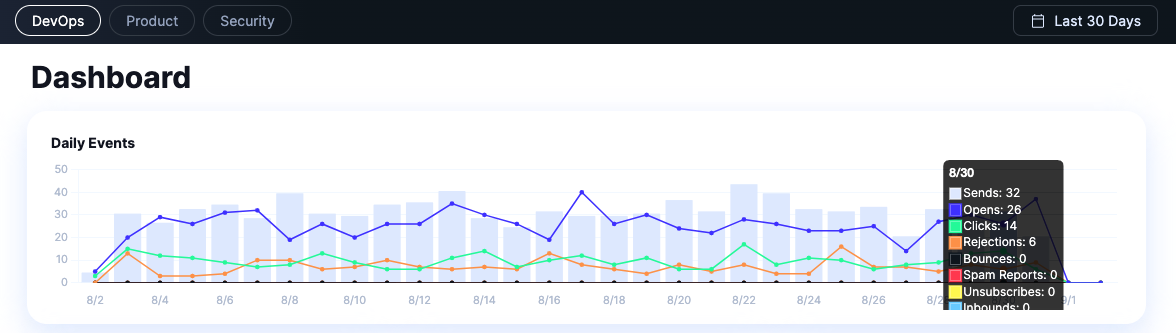
Daily Events
The first section of the Delivery dashboard displays a graph of your overall sending activity that includes various metrics - Sends, Opens, Clicks, Rejections, Bounces, Spam Reports, Unsubscribes, and Inbounds.
| Daily Events | Description |
|---|---|
| Sends | Recorded when you send emails to your users. |
| Opens | Recorded when your emails gets opened by users. |
| Clicks | Recorded when links in your emails get clicked on by users. |
| Rejections | Recorded when emails get rejected due to recipients being on a suppression list. |
| Bounces | Recorded when a server cannot or will not deliver messages. |
| Spam Reports | Recorded when users report emails you sent them as spam. |
| Unsubscribes | Recorded when users unsubscribe from your emails. |
| Inbounds | Recorded when you receive emails via Amply’s inbound parse webhook. |
The Daily Events graph gives you a bird's eye view of your email delivery health. It enables you to see how your email is performing and pick up on any trends at a glance.
Reputation Status
The next section displays visualizations of your reputation status. These are three donut pie charts that include Domain Status, IP Address Status, and IP Pool Status. They have a significant impact on your sending reputation and deliverability.
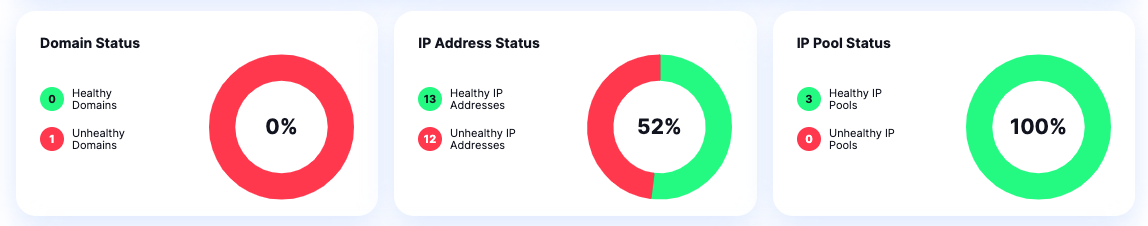
These charts make it easy for you to track your reputation status and see if there are any issues negatively affecting your deliverability. The aim is to keep all three of these charts healthy and looking green.
Domain Status
The Domain Status chart allows you to quickly see if the sending reputation associated with verified domains is positive.
IP Address Status
The IP Address Status chart allows you to quickly see if the sending reputation associated with IP addresses is positive.
IP Pool Status
The IP Pool Status chart allows you to quickly see if the sending reputation associated with a pool of IP addresses is positive. If any IP addresses in the pool are unhealthy, then the pool is unhealthy.
Bounce & Spam Rate
The third section displays a graph of your bounce and spam rates. Both of these metrics are critical for your deliverability. A high bounce or spam rate will negatively affect your ability to get emails delivered and result in a low sender score over time. A general rule of thumb is to keep both of these rates below 5%. If either gets higher than that, it's an immediate red flag that needs to be addressed.
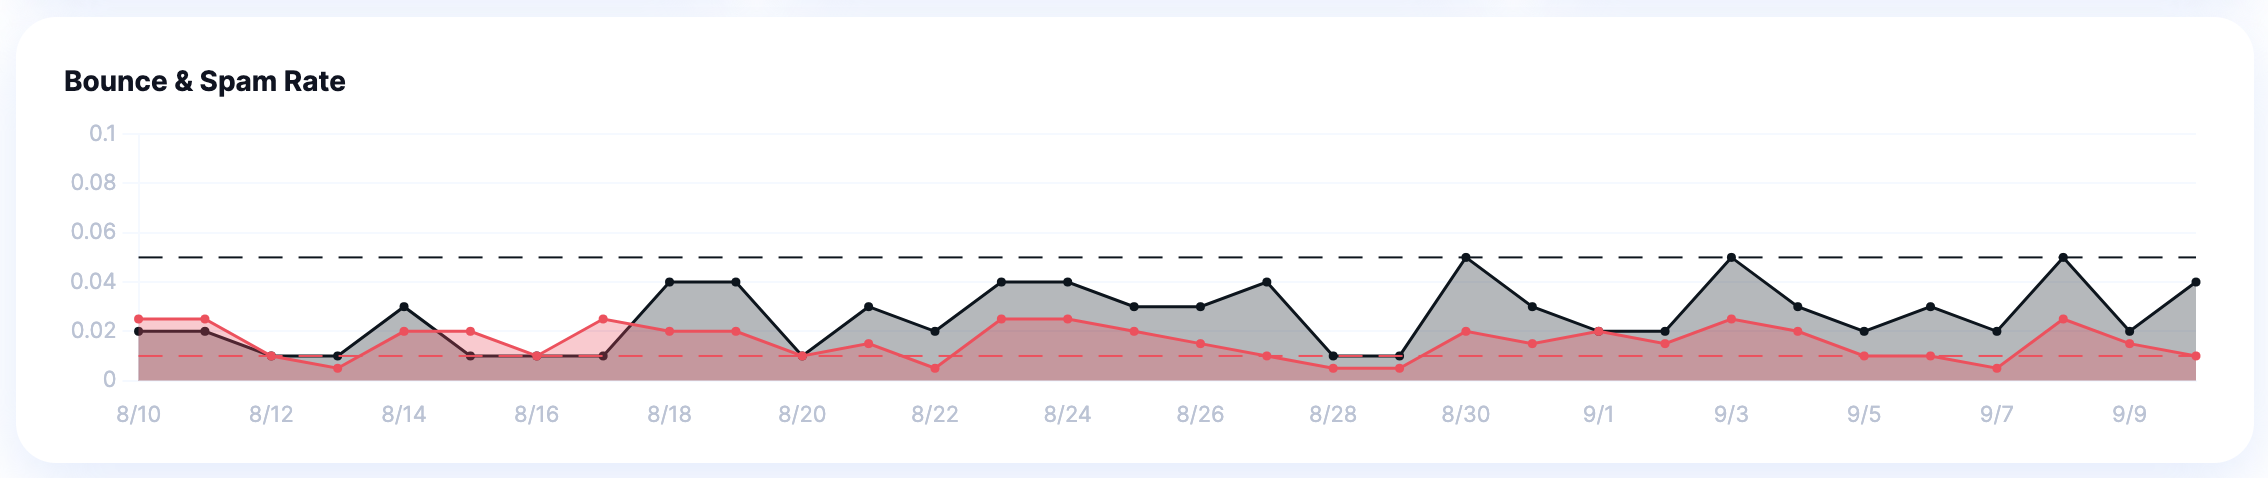
This graph enables you to monitor your bounce & spam rates so that everything is working as it should. If you get a sudden increase in either of these factors, you'll be able to see it immediately.
Updated about 1 year ago