
Users Dashboard
Learn how to navigate the users section of the dashboard.
The Users dashboard provides insight into how your users are interacting with your app. Transactional emails consist of high-value user events like registering an account, receiving alerts, or making purchases, so it's vital to track how your users engage with these messages.
On this page, you'll see metrics and visualizations of user activity within your app. These help you understand how your app is performing and help you gauge user engagement, retention, acquisition, and stickiness.
Active Users
The first section of the Users dashboard displays your Total Active Users and Daily Active Users.
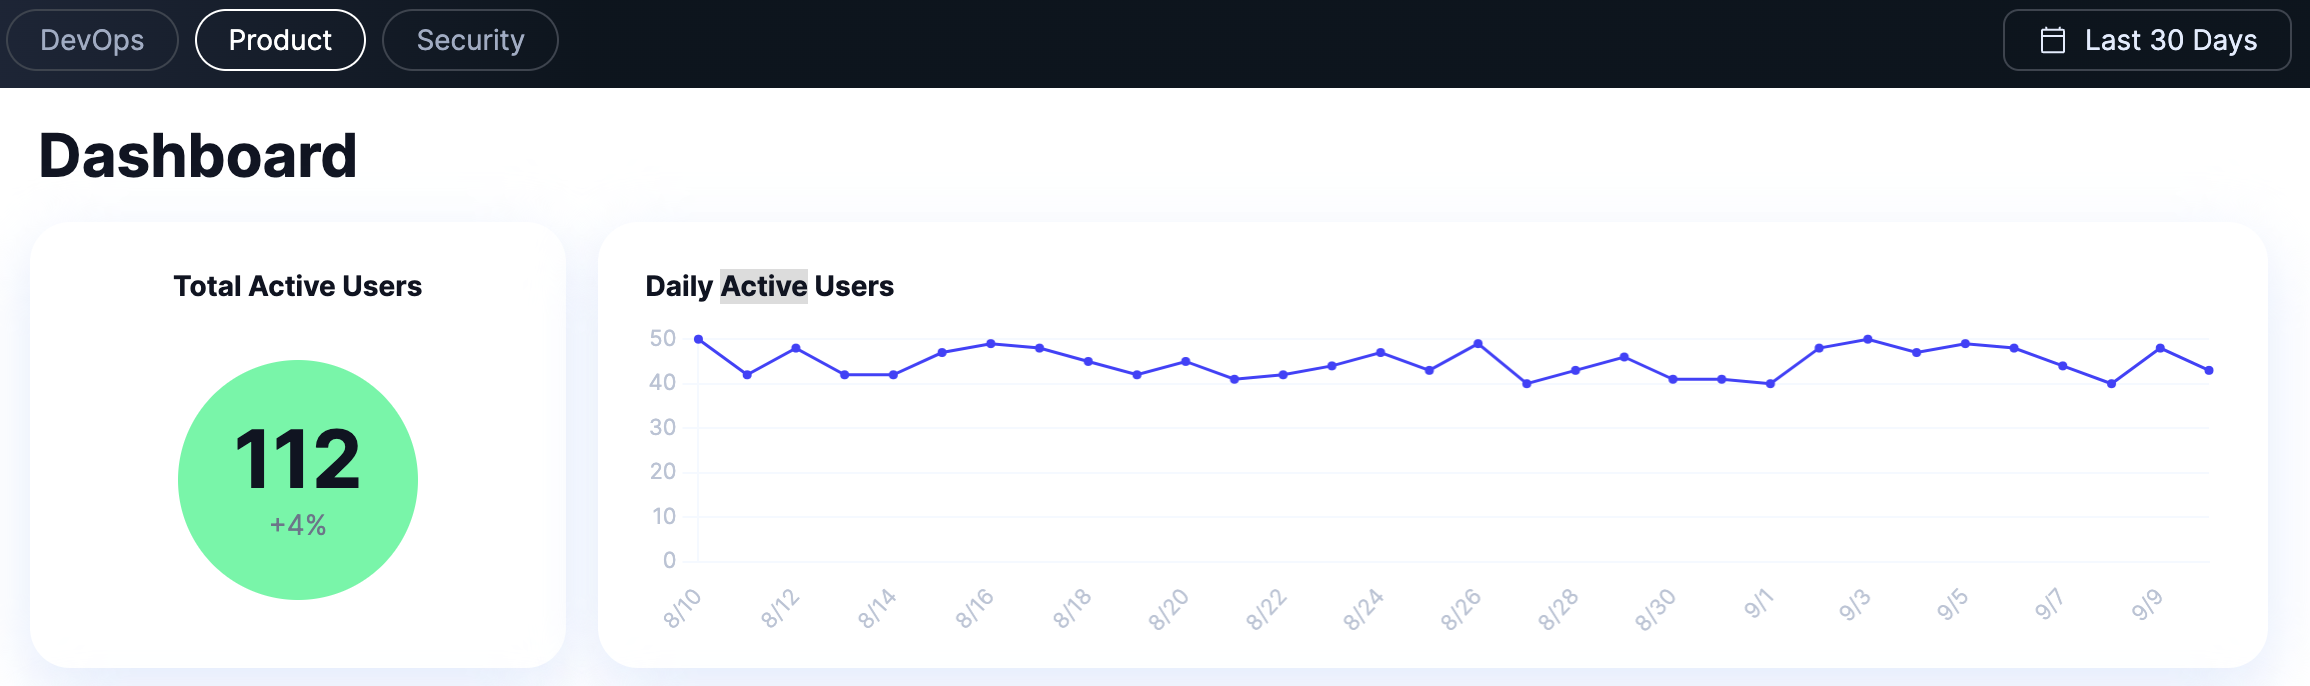
Total Active Users is the total number of users who have had any activity with your app within a time period. A user is counted as an active user if they've interacted with your app at least once (within that time period). Below the total number, you'll see the percent change compared to the last period.
Daily Active Users show you the number of users who've interacted with your app daily.
Both of these metrics are valuable for measuring user engagement and retention. They help you answer 2 key questions:
- Are people using my product over time?
- Are people using my product on a daily basis?
Tracking these numbers is important to see how your product usage is trending (upward or downward). The more users you can get to interact with your app and keep coming back to it on a regular basis, the more your product will grow over time.
Monitor these metrics and see what factors influence them to increase product engagement.
New Users
The next section displays visualizations for Total New Users and Daily New Users.
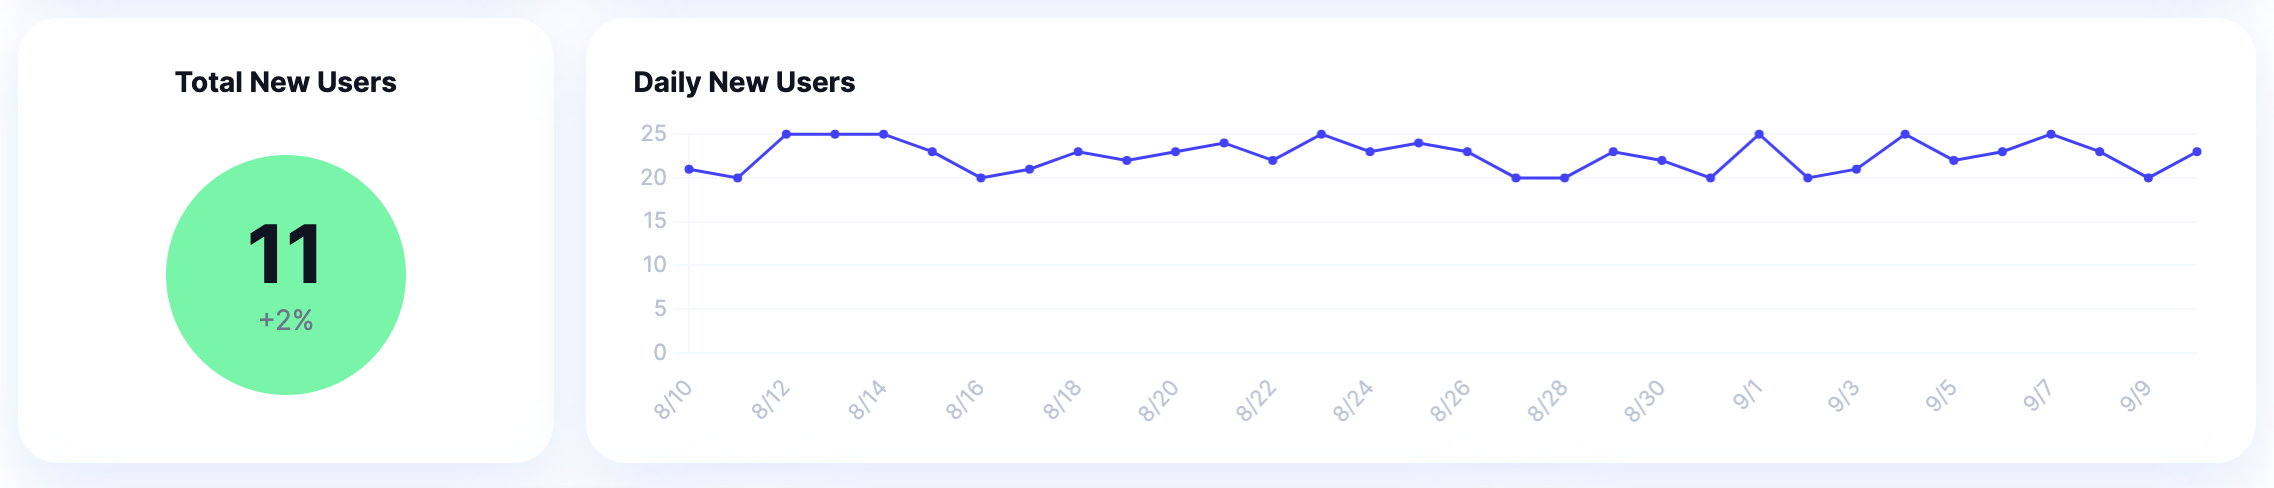
Total New Users is the total number of new users you've gained within a time period. A user is counted as a new user if they're interacting with your app for the first time. Below the total number, you'll see the percent change compared to the last period.
Daily New Users shows you how many new users you're getting daily within a certain time period. These numbers are displayed in a line graph and are an easy way for you to track your product growth.
Both of these metrics are valuable for measuring user acquisition. They help you answer 2 key questions:
- Are more people using my app over time?
- Am I getting more people to use my app on a regular basis?
Similar to Active Users, you should track these numbers to see how your product growth is trending.
User Engagement Rate
The last section displays visualizations for Average Events Per User, Average Events Per Day, and Email Engagement Rate.
These 3 metrics measure app engagement by showing the average frequency of your users' account activity.
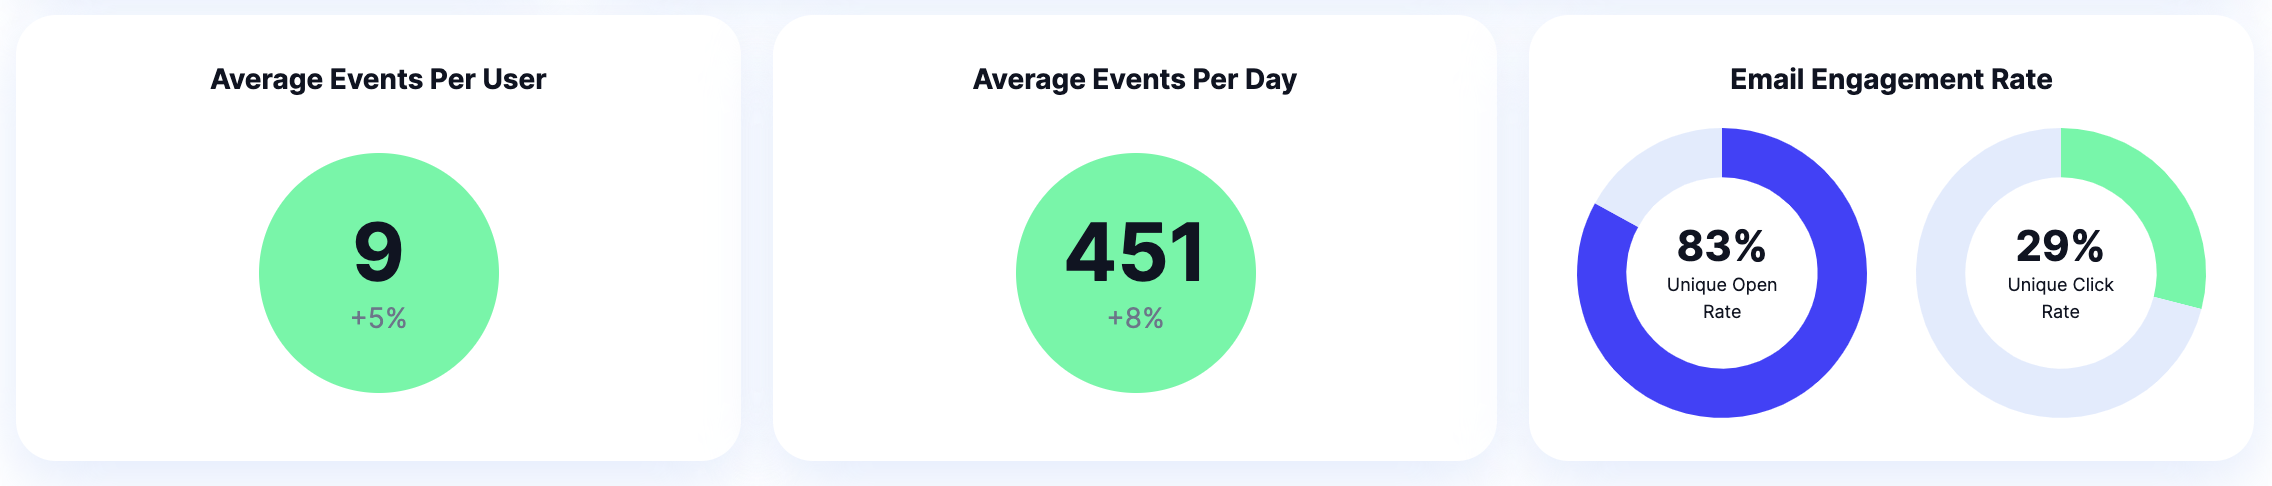
Average Events Per User
This metric shows you the average number of engagements per user. This helps you understand how often users engage with your product and is a great measure of user stickiness. It helps you answer the question:
- How often are users engaging with my product?
This is valuable to understand because users who engage with your app more frequently are considered stickier. Stickier users see more value in what you're providing them and tend to retain longer term.
Average Events Per Day
This metric shows you the average number of engagements your users take per day. This helps you understand if users repeatedly engage with your product. It helps answer this question:
- Are users regularly interacting with my product?
Email Engagement Rate
Email Engagement Rate consists of 2 donut pie charts that display your unique open rates and unique click rates. They give you the percentage of engaged users vs. unengaged ones - people who opened/clicked your messages vs. ones who didn't. It helps you understand the ratio of your user base who actively interacts with your email.
This is different from the above visualizations because it only considers engagement within an email client (the above visualizations consider the action that triggered the email to be an engagement, whether or not they actually opened/clicked on a link within the transactional email).
These metrics are valuable for measuring user conversion and churn. You can easily identify engaged users who are more likely to convert to paying customers, and unengaged ones who are more likely to churn.
Updated about 1 year ago